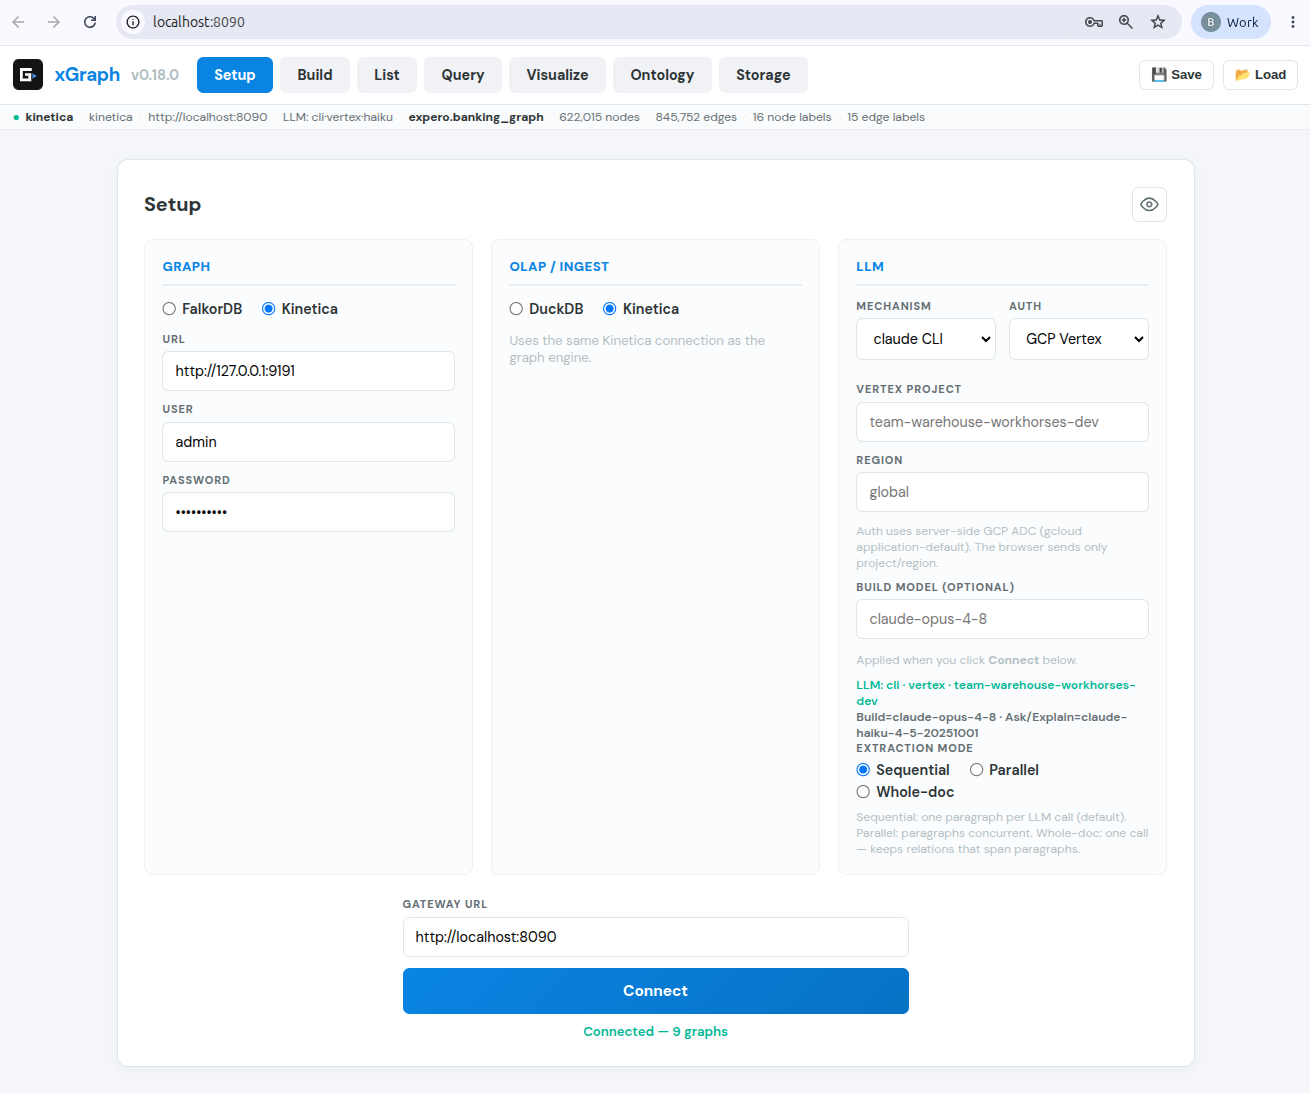
Three engine choices, picked independently
In Setup you choose each one on its own. The gateway resolves the combination behind one API, so the frontend and every query stay engine-agnostic.
| Choice | Options | What it does |
|---|---|---|
| Graph engine | Kinetica · FalkorDB | Stores the graph and runs the traversal (GQL or openCypher). |
| OLAP / ingest | Kinetica · DuckDB | Joins, aggregations, and reading Parquet, CSV and S3. |
| LLM | Claude | Natural language to query, natural language to SQL, and plain-English explanations. |
FalkorDB + DuckDB + Claude is a fully on-premises route with no Kinetica. Kinetica + Kinetica is the validation baseline.
The workflow
The action bar runs left to right:
- Build. Create a graph from tables and files with a NODES/EDGES builder, or from documents: upload a PDF or text and the LLM extracts entities and relationships that merge into a named graph.
- List. The graphs on the connected engine, with node and edge counts and the SQL that built each one.
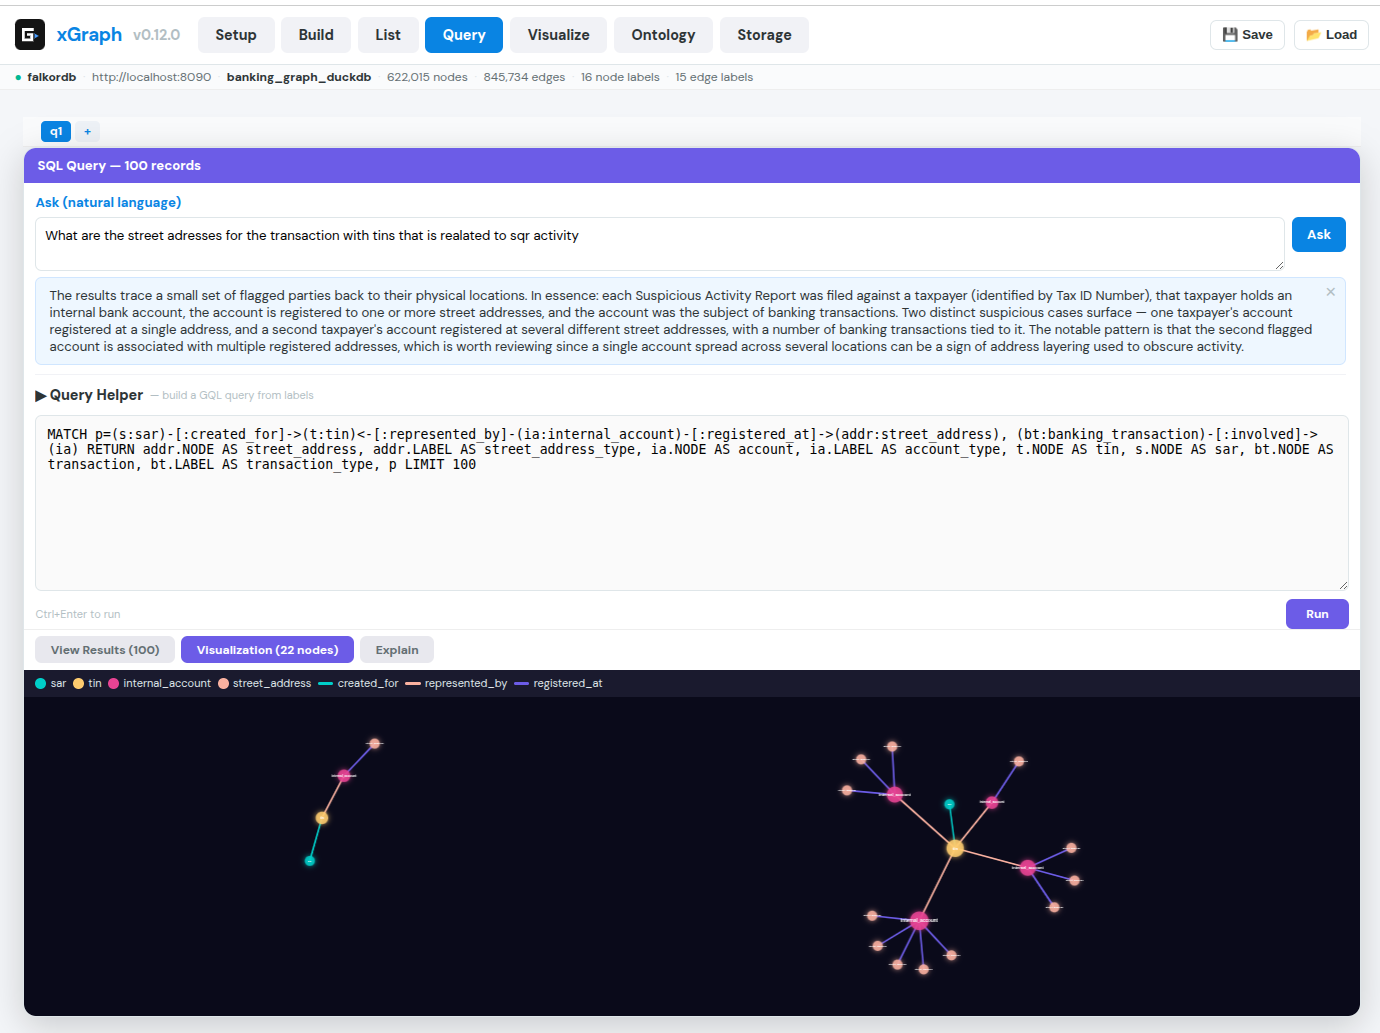
- Query. Ask in plain English, build with the Query Helper, or paste GQL/Cypher. Every route feeds one editor.
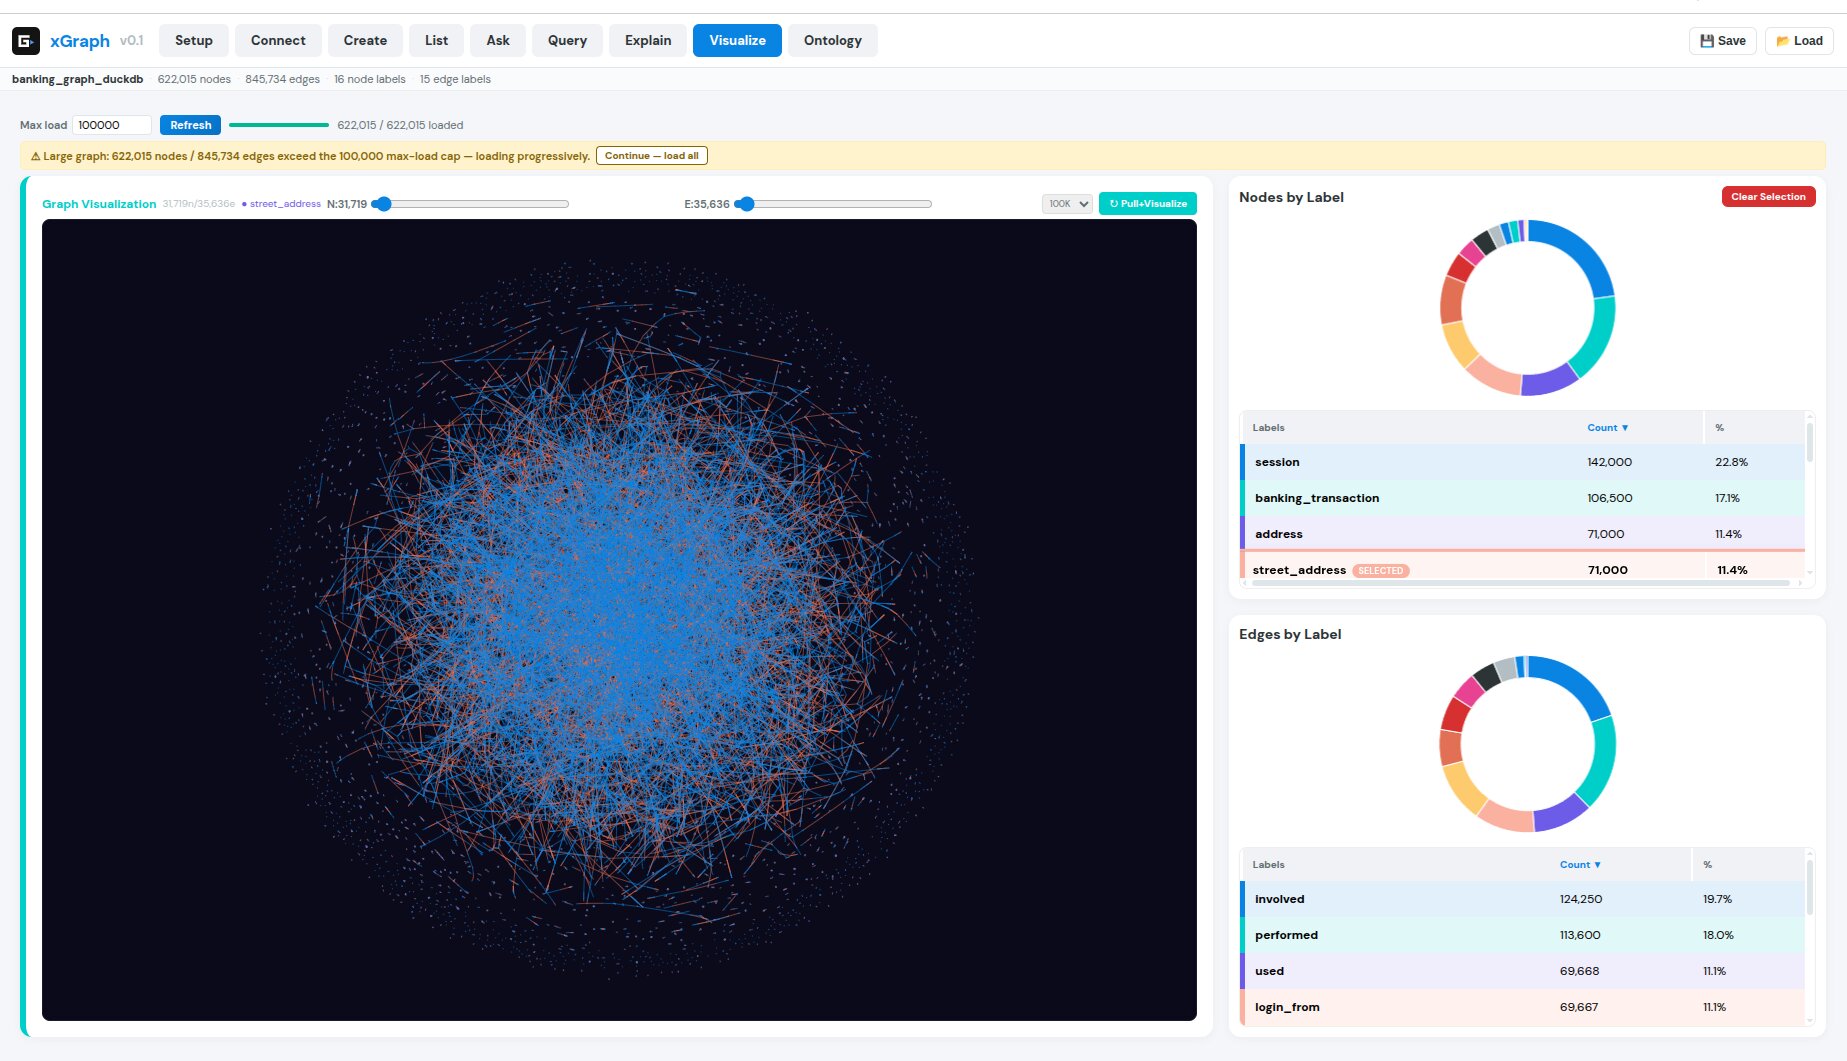
- Visualize. A progressive, paged render colored by node label, with label selection and breakdowns.
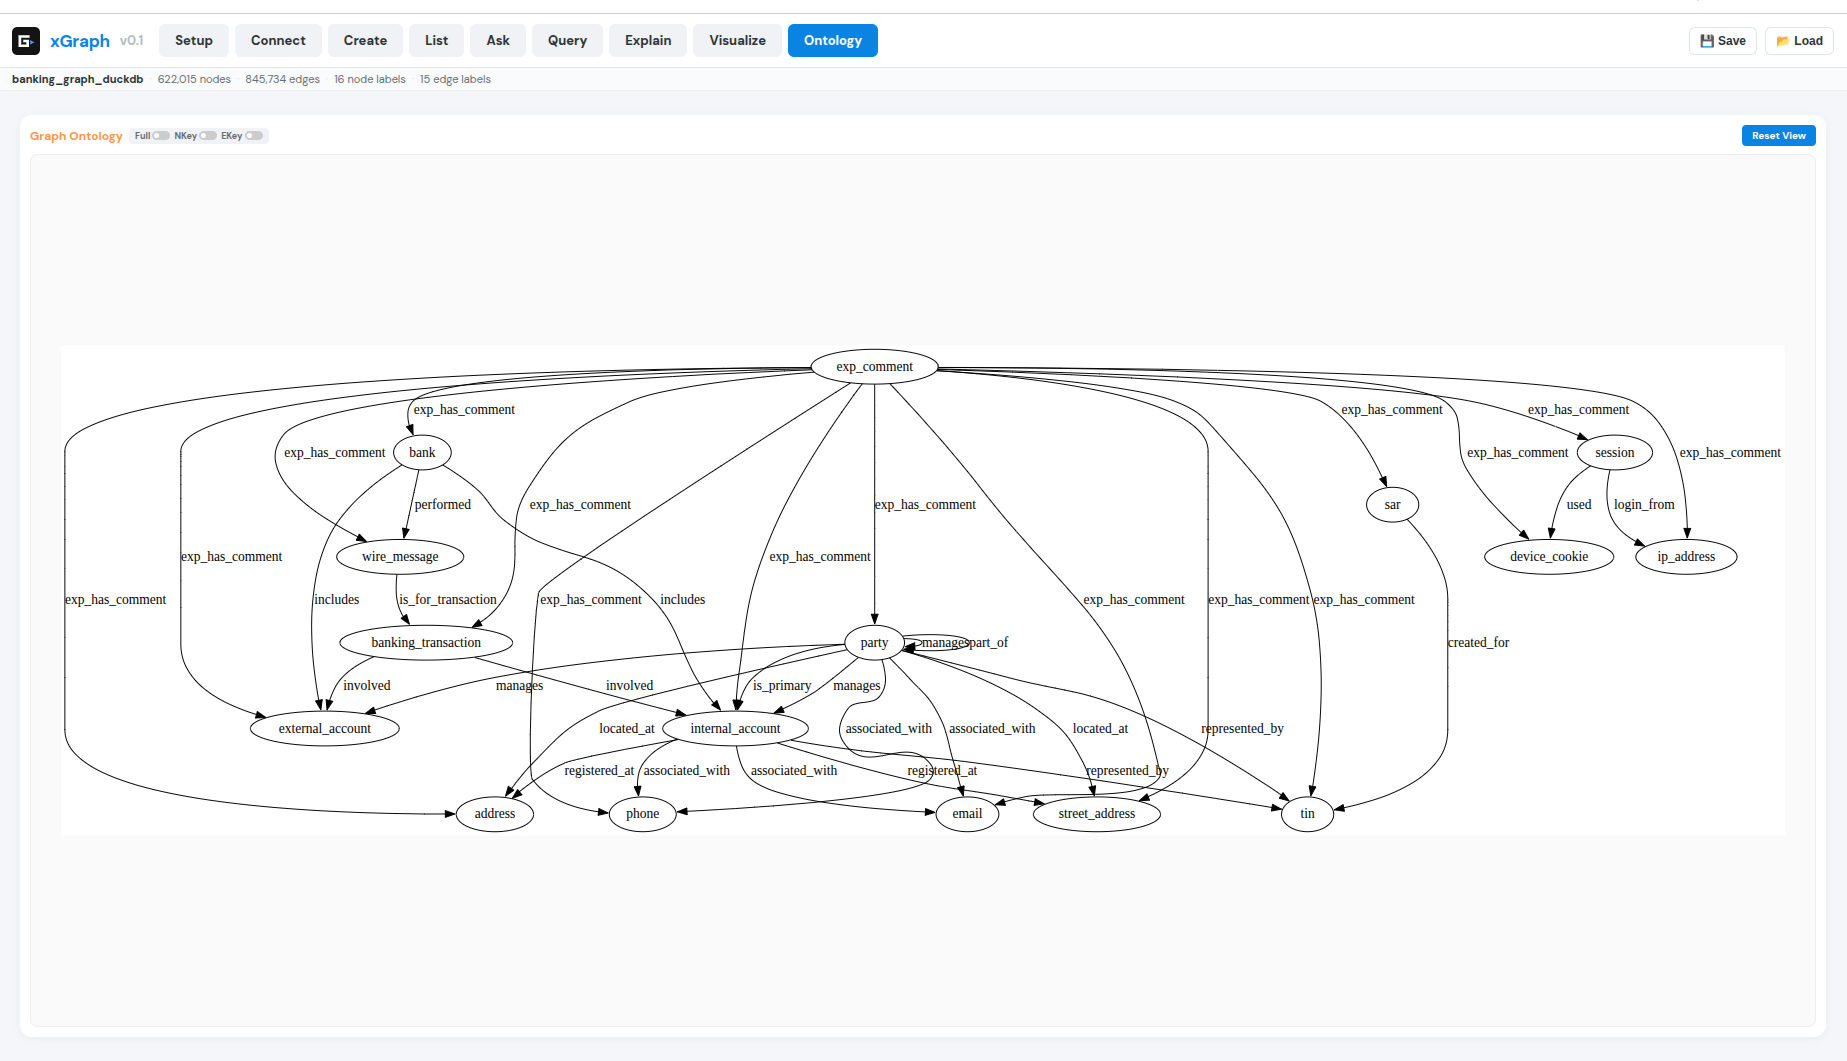
- Ontology. The live label and relationship schema, refreshed whenever the graph changes.
- Storage. The backing tables or source files, plus a recipe of how the graph was built.
Explain, with post-join hydration
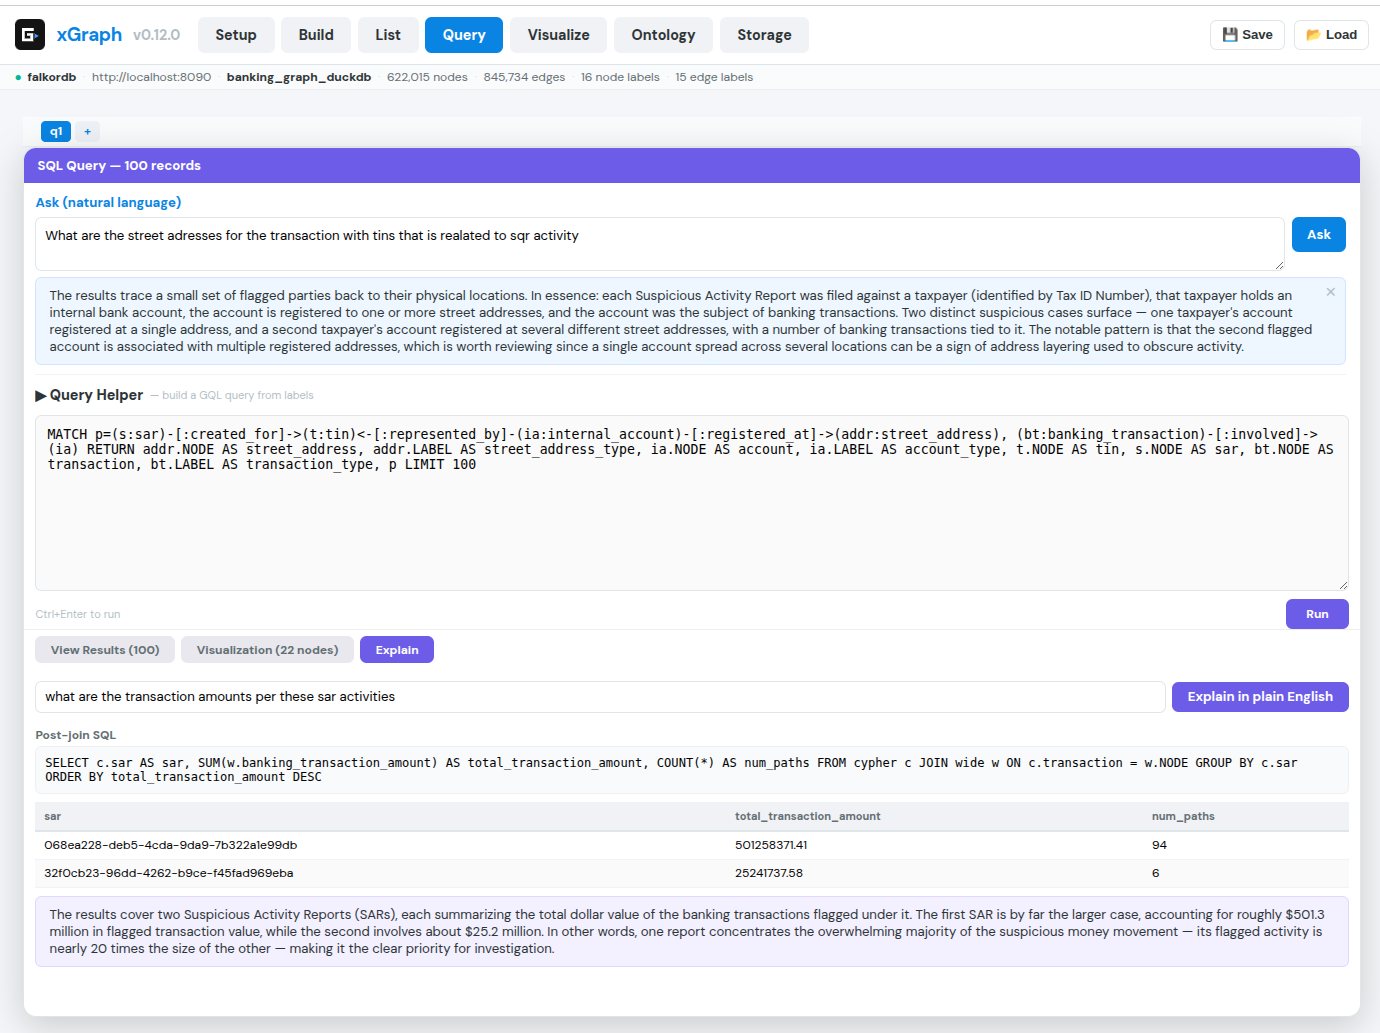
Wide node tables bloat graph-engine memory when every column becomes a node property. xgraph keeps the graph skinny, holding only identity and the columns a query filters on, and leaves attribute-rich columns in Parquet or CSV. After a traversal returns a small set of ids, a post-join fetches just those rows' attributes.
Run a suspicious-activity traversal, then ask Explain: who has the most SAR activity, using the party name? xgraph reads the Cypher to learn which column holds party ids, maps "party name" to the real attribute column, and runs a read-only DuckDB join over the Parquet file:
SELECT w."party:party_name", COUNT(*) AS number_of_paths
FROM cypher c JOIN wide w ON c.c_node = w.NODE
GROUP BY 1 ORDER BY number_of_paths DESC
It then turns the ranked result into a plain-English answer. The count is computed by DuckDB, not estimated by the model, so the ranking is deterministic for a given result.
Graphs from documents
Extract turns unstructured text into a graph with an open-ended ontology. Three things keep it clean as documents accumulate:
- Label folding. Synonymous types collapse to one canonical label: "startup" and "firm" both become
Company. The learned aliases are saved, so they cost nothing next time. - Facets and axes. A node carries a label vector, such as
Companyon the EntityType axis andAIon the Industry axis, so classifications aren't lost. - A provenance ledger. Every document is fingerprinted with sha256. Re-submitting the same bytes is a no-op, and the graph records which documents built it.
Run it yourself
The code is on GitHub: github.com/karametebkaan/xgraph. It ships with a banking demo graph, so you can explore a real graph on first launch.
git clone https://github.com/karametebkaan/xgraph && cd xgraph
./scripts/unzip-data.sh                       # banking demo data
cd backend && python3 -m venv .venv && ./.venv/bin/pip install -r requirements.txt
cp .env.example .env && cd ..
docker run -p 6379:6379 -p 3000:3000 falkordb/falkordb:latest
./xgraph start                                # UI + API on http://localhost:8090
- Open http://localhost:8090. The gateway serves the UI itself.
- Setup: pick FalkorDB (or Kinetica) as the graph engine and DuckDB as the OLAP engine, enter the host and port, then Connect.
- List or Build a graph, then Query, Ask, Explain and Visualize.
What you need: Python 3 and Docker (for FalkorDB), or a Kinetica instance. Ask, Explain and Extract use Claude, through an Anthropic API key or the claude CLI. Stop the gateway with ./xgraph stop.
The full HTTP API, the extraction model and the developer notes are in the README on GitHub.