The idea in one equation
Stocks are the states of a Markov chain. The chance of moving from stock j to stock i is the share of j's outgoing dollars that goes to i. A stock's MarketRank is its stationary probability: where a dollar ends up after the flows have run for a long time.
This is the same construction as PageRank, with dollars in place of hyperlinks. A stock ranks high when it receives a large share of what its senders give away, and when those senders themselves rank high. The rank is a property of the whole flow network, not of a stock's own trading volume. The score is shown as π·N, so 1 means an average stock.
From public prices to a flow graph
Trades are anonymous: the tape shows that a stock traded, not which stock the buyer sold to fund it. MarketRank therefore estimates the flows from public daily bars. Each stock's signed dollar pressure is paired, gravity-style, with the stocks that moved the other way, tilted toward the stocks it usually moves with. The result is a sparse transition matrix over 10,000 US stocks and ETFs, solved by damped power iteration in a deterministic parallel C++ engine.
The interface
The exact ranked table is always the reference. Around it, Fluxscape turns the chain into views you can read:
- Landscape. Stocks are grouped into territories by the communities of the recent flow graph. The height and colour show π relative to size: red attracts more money than its size predicts, blue less.
- Sections (the default). The landscape is seen from above with a crosshair, and two profile charts cut through it, plotting every stock on the cut at its exact value.
- Paths. Any stock can be tracked over the whole history. You drag the chart to move through time, and several stocks can share one chart.
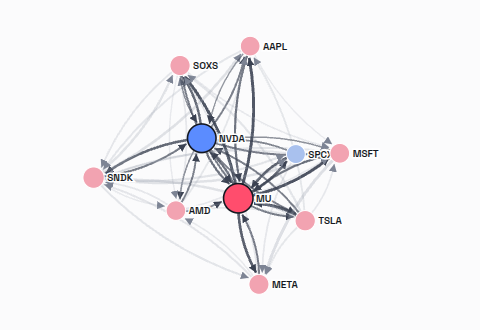
- The transition graph. A close-up of the chain itself around the tracked stocks. Each arrow carries the transition probability through which one stock passes its rank to another.
What we found, honestly
The practical question is whether MarketRank can improve real portfolio moves. We fixed the tests in advance and report them as they came out.
| Test | Result |
|---|---|
| Ten-year weekly walk-forward (2016–2026), after costs, against simply holding the portfolio | Not yet profitable: every configuration trailed buy-and-hold by 3–5% a year. One persistent effect, a short-term reversal in which today's hottest names do slightly worse, is real but small. |
| Estimated flows against observed institutional flows (SEC Form 13F, 39 quarters, 4,000–9,000 managers each) | The estimate gets roughly right which stocks send and receive money, and a little about when. It does not yet capture who pairs with whom. |
| How long do flow communities persist? | About as long as the flow window that defines them: half-life about a week on 20-day flows. |
The solver is sound. Its transition probabilities are only as good as the connectivity fed into it, and daily public bars carry size and a little timing, not pairing.
What's next: learning the connectivity
The transition-probability graph stays at the core. The current work learns the graph's connectivity, who funds whom, directly from market behaviour. A model learns the edges so that the chain built on them minimizes the error of next-week return forecasts. It is tested against graph-free and identity controls, under a protocol registered before any real data is used. Further routes are data that observe pairing more directly: ETF creation and redemption, signed intraday order flow, and 13F pairs mixed into the chain.
Read more
The method, engine, landscape pipeline, evaluation protocol and every result are in the paper: MarketRank: ranking stocks by the stationary probabilities of a Markov chain over estimated money flows (B. Kaan Karamete, Graph AI LLC).
MarketRank is a research preview. For access or collaboration, contact us.
MarketRank is research software. Nothing on this page is investment advice or a recommendation to buy or sell any security. Past and simulated results do not guarantee future performance.